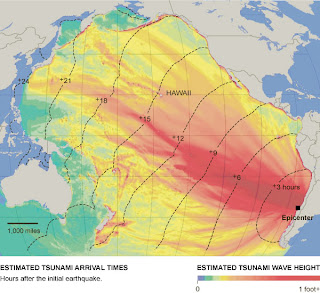
On Saturday February 27, 2010, a magnitude 8.8 earthquake hit near Maule, Chile. This is a map of the estimated tsunami wave heights at various hours after the quake struck.


This map uses 2000 census data to look at the number of households owned by American Indians or Alaska Natives and uses four different classification methods (natural breaks, equal interval, quantiles, and optimal) to look at the data. In the revised map, all of the numbers were changed from ratios to percentages and a title and subtitle were added to each legend to tell the audience what the numbers meant and what classification method was used. Boundary lines around the state were deleted and a neatline was placed around the whole page. The map title was moved to the top of the page and placed all on one line and a map subtitle was added to give a little more explanation. A boundary line was placed around both title and subtitle to make them stand out a bit more. Information about the map’s creation was added to the projection and data source information.


This map shows many things found in


After :
The purpose of this map is to show the differences between 2 generalization methods. The first method is ‘Simplify Line’, a tool used in ArcGIS 9.3. The second method is from a website called MapShaper, where I chose the Douglas-Peucker algorithm to generalize the data. Only a small section of the original map was chosen to show how the two differ from the original. In the revised map, I marked out where the example section was in the original data. Scale bars were added for all the views and a north arrow was placed on the map. A legend was added since the river lines in each example were different colors. A subtitle was added to try to make the purpose of the map clearer. Information about the map, such as date of creation and where the data came from, was added.