Wednesday, April 21, 2010

Lab 6

Part A


This is a dot map showing the Hispanic population in each county of
Idaho. Each dot represents 30 people and highly populated areas are easily determined. Data for this map came from the U.S. Census Bureau for the year 2000.

Part B1


This is a map of the capital cities in the world with a population greater than 750,000, where graduated circles are used for symbolization. The different color values for each symbol were used to help distinguish each circle. Data for this map came from ESRI.


Part B2


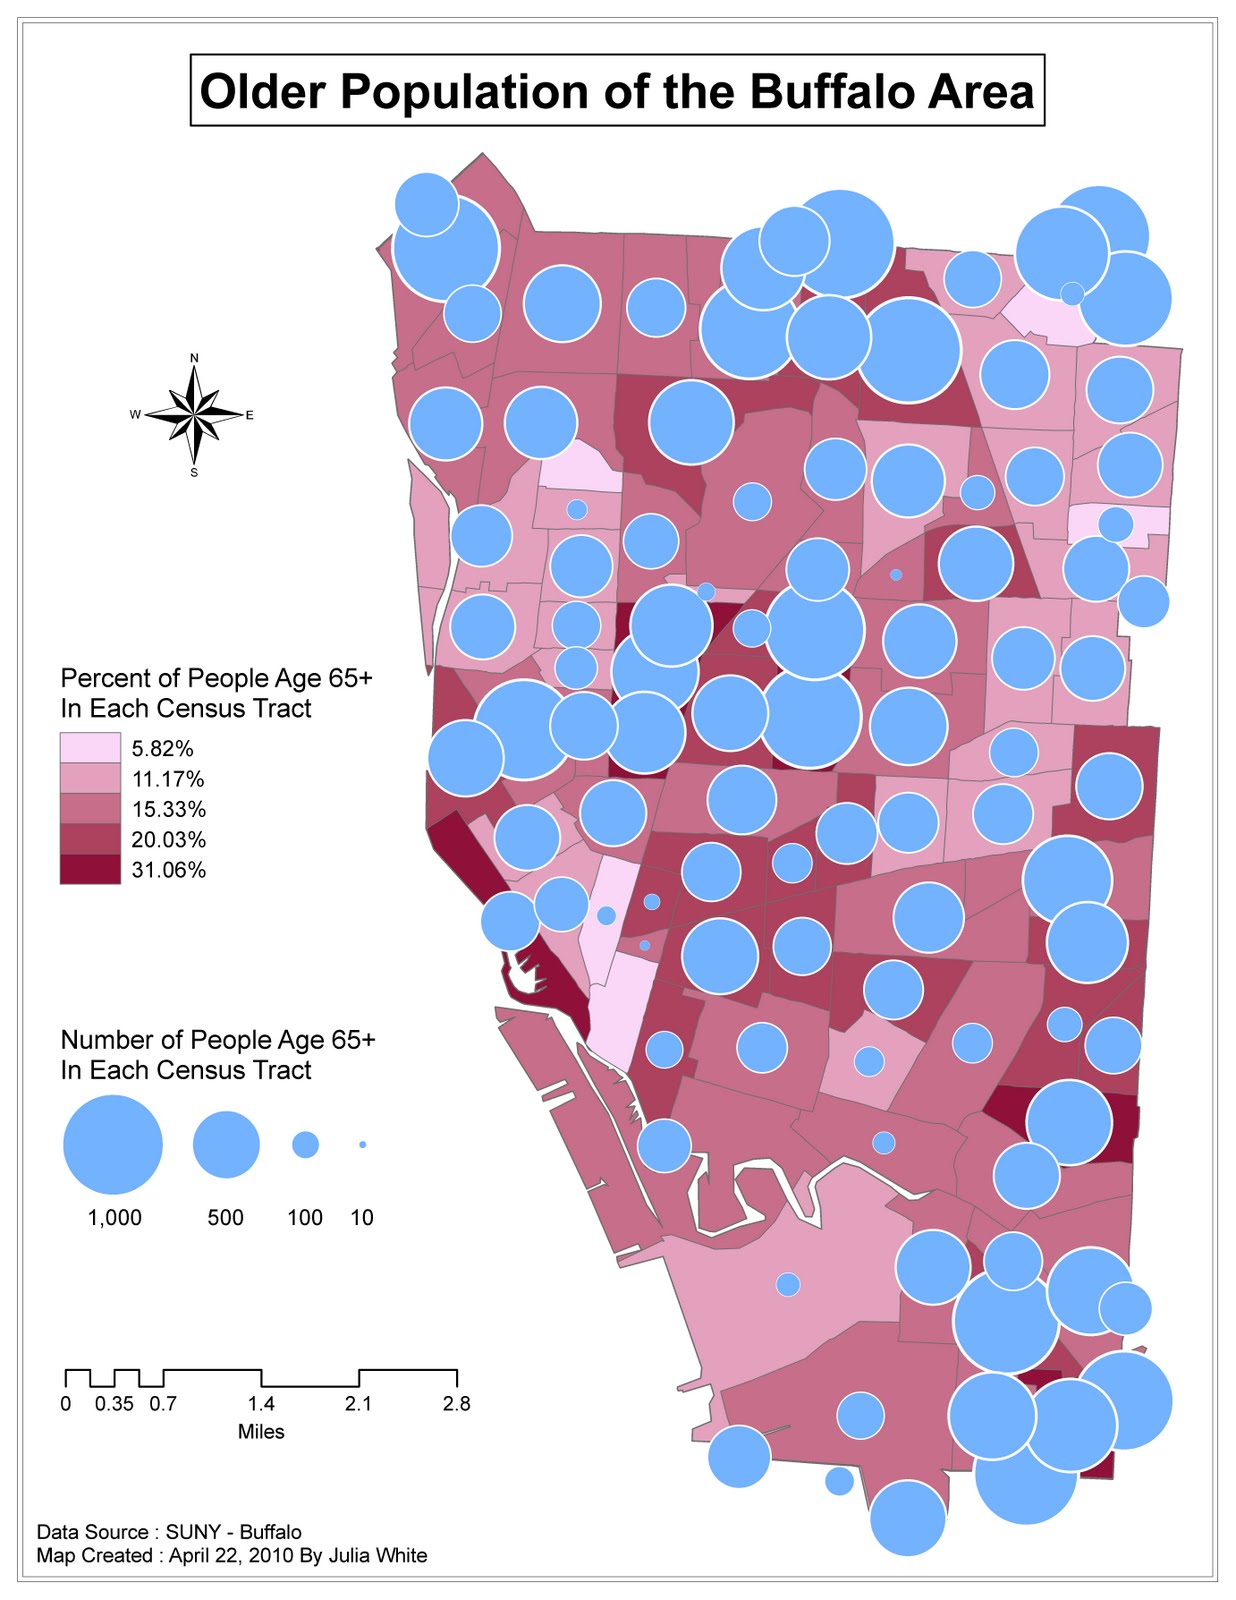
This is a bivariate map of people in the Buffalo area that are 65 years old or older. The choropleth map shows the percentage of elderly in each census tract. The proportional map shows the number of elderly in each tract. Data for this map came from SUNY-Buffalo.

No comments:

Post a Comment